February 2025 Monthly Commentary
- Mar 5, 2025
- 3 min read
Updated: Apr 23

Piton February Market Review
It feels like it’s been a long time since investors could say fixed income markets are outperforming equities year to date. February brought heightened volatility in risk markets; US treasuries and high-grade bonds benefited in a shift towards safety. While mixed economic data and earnings reports drove markets most days, the increased political theater created uncertainty throughout global markets.
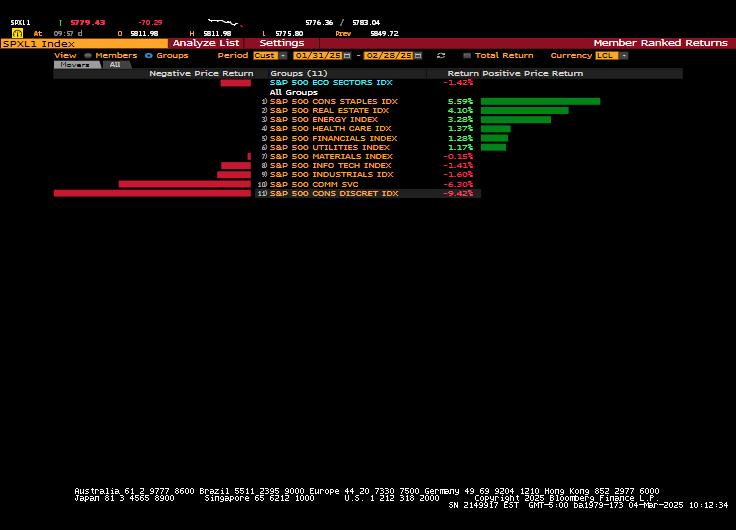
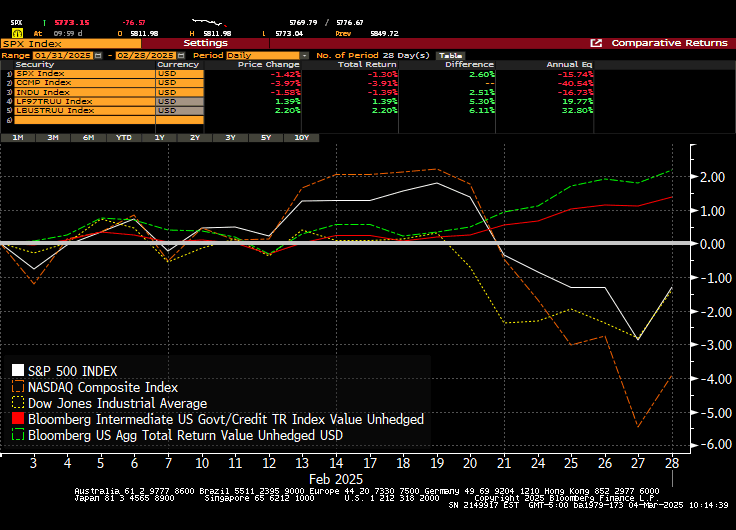
The Nasdaq finished lower among the US equity composite, and some of the “magnificent seven” companies saw earnings pressure. Defensive and interest rate sensitive sectors outperformed with consumer staples higher by 5.7%. Real estate companies also increased by 4.23%, and the energy sector was positive 3.97%. Consumer discretionary stocks led the US equity markets lower, falling by 9.37%, followed by communication services lower by 6.29%. Overall, the S&P index fell 1.3% in February, with the Nasdaq market down 3.91%. Year-to-date, the S&P remains positive (+1.44%), while the Nasdaq is in the red (-2.31%), and the Dow Jones Industrial Average is higher (+3.32%).
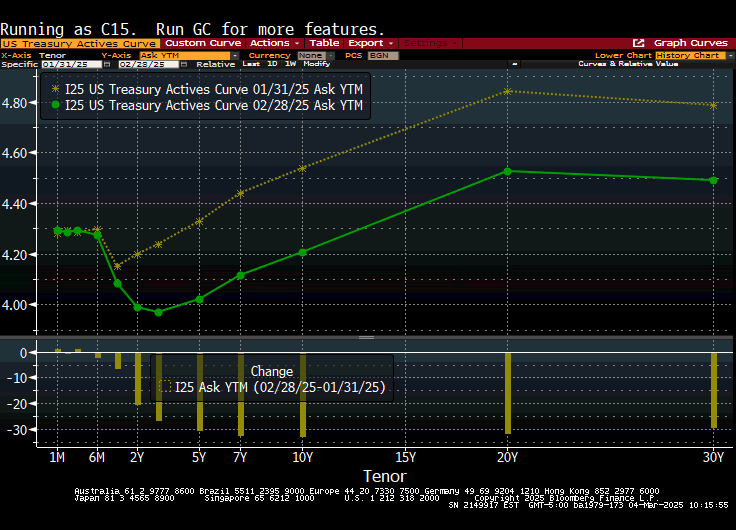
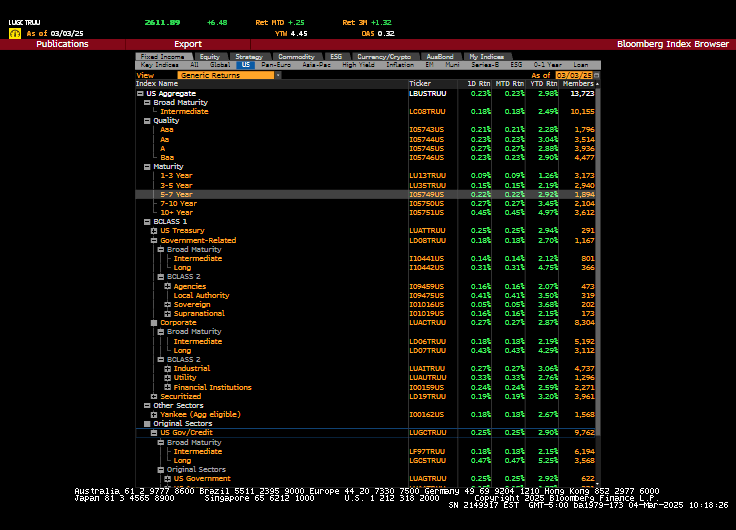
As mixed economic data and company reports were released, interest rates fell 20-30 basis points across the US Treasury curve. In addition, further tariff realities, “DOGE” discussions, and Gaza and Ukraine proposals kept markets unsettled. The US 10-year treasury note finished the month at its lowest yield for this year, at 4.20%. While the curve flattened a bit, 2-year treasury notes also finished at a lower yield of 3.99%. As bond prices rose, Treasury returns notched a 2% total return in February, while the aggregate bond indices returned 2.2%. Intermediate bonds rose a respectable 1.39%.
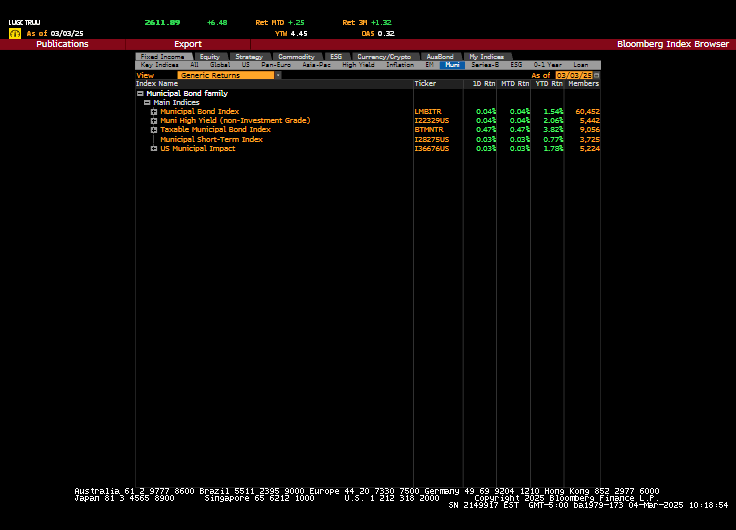
Corporate bond prices rose with government bonds, although spreads widened 8-10 basis points (due to equity volatility). New corporate bond issuance remains robust, with $161 billion in new issuance in February, although slightly lower than the expected $175 billion. High-yielding bonds were positive during the month (0.67%), but underperformed investment grade sectors. Municipal bonds increased in value (Muni index up 0.99%), but lagged government bonds. Municipal ratios are still on the expensive side inside of 10 years (65%-68% of corresponding treasury yields) but have become slightly cheaper with the sharp rally in treasuries. Uncertainty around tax policy remains a risk to the sector.
Data Recap
From the first trading day of February, it was clear markets would be on alert for US policy by the minute. Tariff news initially hit markets on 2/3rd. A few phone calls with prime ministers and delays on tariffs had the markets rebounding. On the following day, President Trump and Prime Minister Netanyahu discussed “Project Riveria”, having the US rebuild the area of Gaza. This was met with polarizing views. The next day, the US saw softer service sector data and earnings weakness from Google and AMD. Bonds began to rally, and we hadn’t even gotten to the monthly jobs data.
Economic data continued to support growth in the US, although some sectors are starting to show weakness. Monthly non-farm payroll data was lower than expected, but revisions to prior months were stronger. Maybe more importantly, last month, hourly average earnings jumped during the report, suggesting wage inflation is trending higher. Neither stocks nor bonds enjoyed that data. Retail sales and housing data also saw weakness last month. Consumer confidence reports dipped slightly as well.
Inflation data was generally stronger for the month (CPI and PPI), although the Fed’s favorite gauge of the core PCE was within expectations. On February 19th, the market digested the FOMC minutes from their previous report. It was clearer that a “wait and see” approach was still favored in lowering rates. Some governors suggested a restrictive policy was still warranted until inflation reached its 2% target, although most feel the Federal Reserve would like more clarity on the results of new government policy.
Supporting footnotes: